فهرست ایالتهای آمریکا بر پایه تراکم جمعیت
این مقاله یک فهرست کامل از مناطق آمریکا میباشد که جمعت را به فهرست کردهاست.[1] ایالات متحده نسبت به کشورهای هم رده خود رشد کمی از جمعیت داشتهاست.[2]
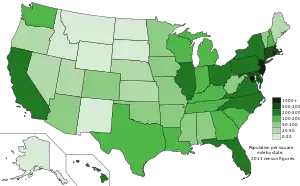
نقشه تراکم جمعیت در ایالات متحده آمریکا سال ۲۰۱۳

New Jersey is the most densely populated state. It is also the second wealthiest in terms of absolute (as opposed to cost of living adjusted) household income.

Despite being home to the most populous city in the country, New York State ranks 7th in overall density.
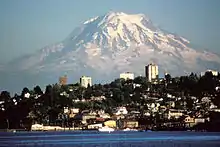
Washington State is ranked 25th in density, but is still above the national average.

Despite a fairly average population density, Vermont has one of the smallest populations due to its small overall area.

Idaho's population has increased rapidly in recent decades, but its population density, relative to other states, is low.

About half of the population of Alaska lives in the Anchorage metropolitan area.

Puerto Rico ranks third among the most densely populated areas in the U.S. (behind DC and NJ)
تراکم جمعیت ایالتها، قلمروها، مناطق جغرافیایی و بخشها
| راهنمای جدول |
| Division totals – 9 divisions for 50 States and DC |
| Region totals – 4 regions (2 or 3 divisions each) |
| قلمروها |
| رتبه | ایالت/قلمرو/ منطقه/بخش |
تراکم در هر مایل مربع |
تراکم در هر کیلومتر مربع |
نوع تقسیمات کشوری |
|---|---|---|---|---|
| -- | 10,588.8 | 4,088.4 | MdAtl | |
| 1 | 1,210.1 | 467.2 | MdAtl | |
| 1 | 1,055.9 | 407.7 | Terr. | |
| 2 | 1,017.1 | 392.7 | NEng | |
| -- | قلمرو | 991.0 | 382.6 | USA |
| 3 | 858.0 | 331.3 | NEng | |
| 2 | 792.2 | 305.9 | Terr. | |
| 3 | 759.6 | 293.3 | Terr. | |
| 4 | 742.6 | 286.7 | NEng | |
| 4 | 726.1 | 280.4 | Terr. | |
| 5 | 610.8 | 235.8 | MdAtl | |
| 6 | 475.1 | 183.4 | MdAtl | |
| 7 | 417.0 | 161.0 | MdAtl | |
| 1 | ایالتهای ساحلی اقیانوس اطلس آمریکا | 416.5 | 160.8 | NEast |
| 8 | 364.6 | 140.8 | SAtl | |
| 1 | شمال شرقی ایالات متحده | 345.5 | 133.4 | USA |
| 5 | 295.5 | 114.1 | Terr. | |
| 9 | 285.5 | 110.2 | MdAtl | |
| 10 | 283.2 | 109.3 | ENC | |
| 11 | 246.1 | 95.0 | Pac | |
| 2 | نیو انگلند | 233.2 | 90.0 | NEast |
| 3 | ایالتهای ساحل جنوبی اقیانوس اطلس | 233.1 | 90.0 | South |
| 12 | 232.0 | 89.6 | ENC | |
| 13 | 218.6 | 84.4 | Pac | |
| 14 | 209.2 | 80.8 | SAtl | |
| 15 | 202.6 | |||
| 4 | ایالتهای مرکزی شمال شرقی | 192.1 | 74.2 | MWest |
| 16 | 183.4 | 70.8 | ENC | |
| 17 | 175.0 | 67.6 | ENC | |
| 18 | 173.7 | 67.1 | SAtl | |
| 19 | 158.8 | 61.3 | SAtl | |
| 20 | 157.5 | 60.8 | ESC | |
| 21 | 147.8 | 57.1 | NEng | |
| 2 | South | 136.3 | 52.6 | USA |
| 22 | 111.3 | 43.0 | ESC | |
| 23 | 107.1 | 41.3 | WSC | |
| 24 | 106.0 | 40.9 | ENC | |
| 5 | East South Central | 105.0 | 40.5 | South |
| 25 | 104.9 | 40.5 | Pac | |
| 26 | 103.1 | 40.8 | WSC | |
| 27 | 95.4 | 36.9 | ESC | |
| 3 | Midwest | 90.0 | 34.7 | USA |
| -- | 89.5 | 34.6 | NAmer | |
| 6 | West South Central | 89.1 | 34.4 | South |
| 28 | 87.9 | 33.9 | WNC | |
| 29 | 77.1 | 29.8 | SAtl | |
| 30 | 68.1 | 26.3 | WNC | |
| 31 | 68.0 | 26.3 | NEng | |
| 32 | 63.7 | 24.6 | ESC | |
| 33 | 58.3 | 22.5 | Mtn | |
| 7 | Pacific | 57.4 | 22.2 | West |
| 36 | 55.3 | 21.4 | WNC | |
| 37 | 50.8 | 19.6 | Mtn | |
| 38 | 43.1 | 16.6 | NEng | |
| 4 | [[غرب ایالات متحده آمریکا]] | |||
| 8 | West North Central | 41.1 | 15.9 | MWest |
| 39 | 40.9 | 15.8 | Pac | |
| 40 | 35.4 | 13.7 | WNC | |
| 41 | 35.3 | 13.6 | Mtn | |
| 9 | ایالتهای کوهستانی | 26.7 | 10.3 | West |
| 42 | 25.4 | 9.8 | Mtn | |
| 43 | 24.3 | 9.4 | WNC | |
| 44 | 19.5 | 7.5 | Mtn | |
| 45 | 17.2 | 6.6 | Mtn | |
| 46 | 11.1 | 4.3 | WNC | |
| 47 | 10.5 | 4.0 | WNC | |
| 48 | 7.0 | 2.7 | Mtn | |
| 49 | 6.0 | 2.3 | Mtn | |
| 50 | 1.3 | 0.5 | Pac |
| State/Territory/ Division/Region |
رتبه |
Pop. dens. /sqmi. |
رتبه |
جمعیت در ۲۰۱۳ |
R a n k |
Land area sqmi. |
Geog. sort |
|---|---|---|---|---|---|---|---|
| 1 | 1210.1 | 11 | 8,899,339 | 46 | 7,354 | MdAtl | |
| 2 | 1017.1 | 43 | 1,051,511 | 50 | 1,034 | NEng | |
| 3 | 858.0 | 14 | 6,692,824 | 45 | 7,800 | NEng | |
| 4 | 742.6 | 29 | 3,596,080 | 48 | 4,842 | NEng | |
| 5 | 610.7 | 19 | 5,928,814 | 42 | 9,707 | SAtl | |
| 6 | 475.1 | 45 | 925,749 | 49 | 1,949 | SAtl | |
| 7 | 417.0 | 3 | 19,651,127 | 30 | 47,126 | MdAtl | |
| 8 | 364.6 | 4 | 19,552,860 | 26 | 53,625 | SAtl | |
| 9 | 285.5 | 6 | 12,773,801 | 32 | 44,743 | MdAtl | |
| 10 | 283.2 | 7 | 11,570,808 | 35 | 40,861 | ENC | |
| 11 | 246.1 | 1 | 38,332,521 | 3 | 155,779 | Pac | |
| 12 | 232.0 | 5 | 12,882,135 | 24 | 55,519 | ENC | |
| 13 | 218.6 | 40 | 1,404,054 | 47 | 6,423 | Pac | |
| 14 | 209.2 | 12 | 8,260,405 | 36 | 39,490 | SAtl | |
| 15 | 202.6 | 10 | 9,848,060 | 29 | 48,618 | SAtl | |
| 16 | 183.4 | 16 | 6,570,902 | 38 | 35,826 | ENC | |
| 17 | 175.0 | 9 | 9,895,622 | 22 | 56,539 | ENC | |
| 18 | 173.7 | 8 | 9,992,167 | 21 | 57,513 | SAtl | |
| 19 | 158.8 | 24 | 4,774,839 | 40 | 30,061 | SAtl | |
| 20 | 157.5 | 17 | 6,495,978 | 34 | 41,235 | ESC | |
| 21 | 147.8 | 42 | 1,323,459 | 44 | 8,953 | NEng | |
| 22 | 111.3 | 26 | 4,395,295 | 37 | 39,486 | ESC | |
| 23 | 107.1 | 25 | 4,625,470 | 33 | 43,204 | WSC | |
| 24 | 106.0 | 20 | 5,742,713 | 25 | 54,158 | ENC | |
| 25 | 104.9 | 13 | 6,971,406 | 20 | 66,456 | Pac | |
| 26 | 101.2 | 2 | 26,448,193 | 2 | 261,232 | WSC | |
| 27 | 95.4 | 23 | 4,833,722 | 28 | 50,645 | ESC | |
| 28 | 87.9 | 18 | 6,044,171 | 18 | 68,742 | WNC | |
| 29 | 77.1 | 38 | 1,854,304 | 41 | 24,038 | SAtl | |
| 30 | 68.1 | 21 | 5,420,380 | 14 | 79,627 | WNC | |
| 31 | 68.0 | 49 | 626,630 | 43 | 9,217 | NEng | |
| 32 | 63.7 | 31 | 2,991,207 | 31 | 46,923 | ESC | |
| 33 | 58.3 | 15 | 6,626,624 | 6 | 113,594 | Mtn | |
| 34 | 56.9 | 32 | 2,959,373 | 27 | 52,035 | WSC | |
| 35 | 56.1 | 28 | 3,850,568 | 19 | 68,595 | WSC | |
| 36 | 55.3 | 30 | 3,090,416 | 23 | 55,857 | WNC | |
| 37 | 50.8 | 22 | 5,268,367 | 8 | 103,642 | Mtn | |
| 38 | 43.1 | 41 | 1,328,302 | 39 | 30,843 | NEng | |
| 39 | 40.9 | 27 | 3,930,065 | 10 | 95,988 | Pac | |
| 40 | 35.4 | 34 | 2,893,957 | 13 | 81,759 | WNC | |
| 41 | 35.3 | 33 | 2,900,872 | 12 | 82,170 | Mtn | |
| 42 | 25.4 | 35 | 2,790,136 | 7 | 109,781 | Mtn | |
| 43 | 24.3 | 37 | 1,868,516 | 15 | 76,824 | WNC | |
| 44 | 19.5 | 39 | 1,612,136 | 11 | 82,643 | Mtn | |
| 45 | 17.2 | 36 | 2,085,287 | 5 | 121,298 | Mtn | |
| 46 | 11.1 | 46 | 844,877 | 16 | 75,811 | WNC | |
| 47 | 10.5 | 48 | 723,393 | 17 | 69,001 | WNC | |
| 48 | 7.0 | 44 | 1,015,165 | 4 | 145,546 | Mtn | |
| 49 | 6.0 | 50 | 582,658 | 9 | 97,093 | Mtn | |
| 50 | 1.3 | 47 | 735,132 | 1 | 570,641 | Pac | |
| Mid-Atlantic | 1 | 416.5 | 4 | 41,324,267 | 8 | 99,223 | NEast |
| ایالتهای نیو انگلند آمریکا | 2 | 233.2 | 9 | 14,618,806 | 9 | 62,688 | NEast |
| South Atlantic | 3 | 233.1 | 1 | 61,783,647 | 5 | 265,062 | South |
| East North Central | 4 | 192.1 | 3 | 46,662,180 | 6 | 242,902 | MWest |
| East South Central | 5 | 105.0 | 8 | 18,716,202 | 7 | 178,290 | South |
| West South Central | 6 | 89.1 | 5 | 37,883,604 | 4 | 425,066 | South |
| Pacific | 7 | 57.4 | 2 | 51,373,178 | 1 | 895,286 | West |
| West North Central | 8 | 41.1 | 7 | 20,885,710 | 3 | 507,620 | MWest |
| Mountain | 9 | 26.7 | 6 | 22,881,245 | 2 | 855,767 | West |
| Northeast | 1 | 345.5 | 4 | 55,943,073 | 4 | 161,912 | USA |
| South | 2 | 136.3 | 1 | 118,383,453 | 2 | 868,418 | USA |
| Midwest | 3 | 90.0 | 3 | 67,547,890 | 3 | 750,523 | USA |
| West | 4 | 42.4 | 2 | 74,254,423 | 1 | 1,751,053 | USA |
| -- | 10588.8 | -- | 646,449 | -- | 61 | SAtl | |
| -- | 89.5 | -- | 316,128,839 | -- | 3,531,905 | NAmer | |
| 1 | 1055.9 | 1 | 3,615,086 | 1 | 3,424 | Terr. | |
| 2 | 792.2 | 3 | 106,405 | 4 | 134 | Terr. | |
| 3 | 759.6 | 2 | 159,358 | 2 | 210 | Terr. | |
| 4 | 726.1 | 4 | 55,519 | 5 | 76 | Terr. | |
| 5 | 295.5 | 5 | 53,883 | 3 | 182 | Terr. | |
| Total Territories | -- | 991.0 | -- | 3,990,251 | -- | 4,027 | USA |
جستارهای وابسته
منابع
- "Annual Estimates of the Population for the United States, Regions, States, and Puerto Rico: April 1, 2010 to July 1, 2013". 2013 Population Estimates. United States Census Bureau, Population Division. December 2013. Archived from the original (CSV) on 24 August 2014. Retrieved April 24, 2014.
- "State Area Measurements and Internal Point Coordinates". 2010 United States Census. United States Census Bureau. February 11, 2011. Archived from the original on 4 May 2015. Retrieved April 24, 2014.
This article is issued from Wikipedia. The text is licensed under Creative Commons - Attribution - Sharealike. Additional terms may apply for the media files.
