جدول نوکلیدها
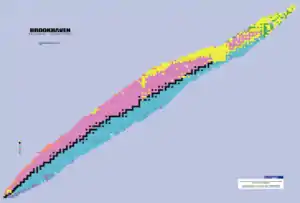
جدول نوکلیدها (به انگلیسی: Table of nuclides) یک نمودار دو بعدی است که محور Y آن عدد اتمی (تعداد پروتونها) و محور X آن نشان دهنده عدد نوترون (تعداد نوترونها) است. هر نقطه در این نمودار نشان دهنده یک نوکلید است که میتواند یک نوکلید واقعی یا یک نوکلید فرضی باشد.
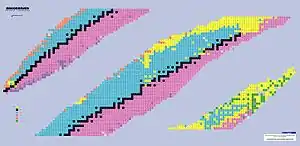
جدول نوکلیدها که جهت دیدن جزئیات بیشتر به سه قسمت تقسیم شدهاست. شکل پیوسته جدول در زیر قابل مشاهده است..
|
منابع
- مشارکتکنندگان ویکیپدیا. «Table of nuclides». در دانشنامهٔ ویکیپدیای انگلیسی، بازبینیشده در ۲۶ دی ۱۳۹۲.
پیوند به بیرون
- Interactive Chart of Nuclides (Brookhaven National Laboratory)
- YChartElements dynamic periodic table and chart of the nuclides, a Yoix application
- پرونده:Compact Isotope Table, Right Lobe.jpg
- Compact Chart of Nuclides (non-standard representation with elements along a diagonal) 70x74.
 The Live Chart of Nuclides - IAEA
- Another example of a Chart of Nuclides from Korea Data up to Jan 1999 only
- Map of the Nuclides (Dead URL Aug 2012)
- The Lund/LBNL Nuclear Data Search (Dead URL Aug 2012)
- Tendency equation and curve of stable nuclides.
- Order the Karlsruhe Nuclide Chart (Nucleonica GmbH))
- The Nuclear Science Portal Nucleonica Commercial site
This article is issued from Wikipedia. The text is licensed under Creative Commons - Attribution - Sharealike. Additional terms may apply for the media files.
