فرودگاه بینالمللی کپیتل ریجن
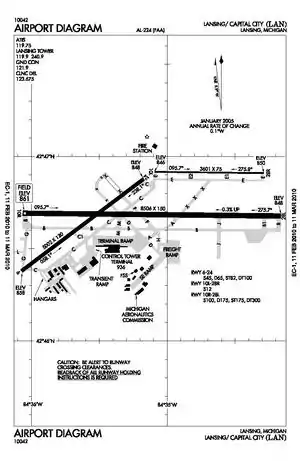
فرودگاه بینالمللی کپیتل ریجن (به انگلیسی: Capital Region International Airport) یک فرودگاه همگانی مسافربری با کد یاتا LAN است که یک باند فرود آسفالت دارد و طول باند آن ۲۵۹۳ متر است. این فرودگاه در شهر لنسینگ کشور ایالات متحده آمریکا قرار دارد و در ارتفاع ۲۶۲٫۴ متری از سطح دریا واقع شدهاست.
| فرودگاه بینالمللی کپیتل ریجن | |||
|---|---|---|---|
 | |||
| یاتا: LAN – ایکائو: KLAN – افایای الآیدی: LAN – WMO:  LAN | |||
| خلاصه | |||
| نوع فرودگاه | همگانی | ||
| مالک/گرداننده | Capital Region Airport Authority | ||
| شهر | لنسینگ | ||
| مکان | |||
| ارتفاع | ۸۶۱ فوت / ۲۶۲٫۴ متر | ||
| وبگاه | |||
| باند فرودگاه | |||
| جهت | طول | سطح | |
| فوت | متر | ||
| 10R/28L | ۸۵۰۶ | ۲۵۹۳ | |
| آمار و اطلاعات (۲۰۱۱) | |||
| مسافربری | ۳۵۸٬۳۰۷ ▲ 39% | ||
شرکتهای هواپیمایی و مقصدهای پروازی
مسافری
| شرکتهای هواپیمایی | مقصدهای پروازی | Refs |
|---|---|---|
| امریکن ایگل | اوهر شیکاگو، ملی رونالد ریگان واشینگتن | [1] |
| دلتا ایرلاینز | فصلی: متروپولیتن شهرستان وین دیترویت | [2] |
| دلتا کانکشن | متروپولیتن شهرستان وین دیترویت، مینیاپولیس−سنت پل | [2] |
| میامی ایر اینترنشنال | چارتر فصلی: کانکون، کینتانا رو، ال آی سی. گوستاو دیاز اورداز، پونتا کانا | [3] |
| یونایتد اکسپرس | اوهر شیکاگو | [4] |
The majority of Delta Connection and United Express passenger flights serving the airport are on بمباردیه سیآرجی ۱۰۰/۲۰۰، بمباردیه سیآرجی ۷۰۰/۹۰۰, and امبرائر ئیآرجی ۱۳۵/۱۴۰/۱۴۵ regional airliners. The majority of American Eagle flights serving the airport are on CRJ700 and ERJ 145 regional airliners.
Miami Air International flights are on بوئینگ ۷۳۷ نسل بعدی aircraft.[note 3]
Passenger statistics
The peak year for passenger activity at Capital Region International Airport was in 1997 with 720,365 total passengers.[5] In 1990 the airport had 149,939 total aircraft operations.[6]
| Year | Total passengers (% change) | Aircraft Operations (% change) |
|---|---|---|
| 2000 | ۶۵۶,۷۰۳(−8.7%) | ۱۱۳,۴۲۰(−7.2%) |
| 2001 | ۵۲۳,۱۵۲(−20.3) | ۱۰۱,۰۶۱(−10.9%) |
| 2002 | ۵۱۴,۲۹۹(−1.7%) | ۹۳,۶۲۸(−7.4%) |
| 2003 | ۵۳۴,۲۸۰(+3.9%) | ۹۲,۵۸۰(−1.1%) |
| 2004 | ۶۵۰,۹۱۵(+21.8%) | ۹۵,۳۹۶(+3.0%) |
| 2005 | ۶۰۹,۹۰۱(−6.3%) | ۸۱,۶۰۷(−14.5%) |
| 2006 | ۵۵۷,۴۱۷(−8.6%) | ۸۰,۶۴۵(−1.2%) |
| 2007 | ۴۹۷,۸۲۴(−10.7%) | ۷۵,۱۳۶(−6.8%) |
| 2008 | ۴۲۹,۶۳۹(−13.7%) | ۴۶,۵۳۸(−38.1%) |
| 2009 | ۲۶۵,۹۶۷(−38.1%) | ۴۲,۱۶۲(−9.4%) |
| 2010 | ۲۵۷,۳۵۰(−3.2%) | ۴۲,۴۶۶(+0.7%) |
| 2011 | ۳۵۸,۳۰۷(+39.2%) | ۳۸,۲۸۷(−9.8%) |
| 2012 | ۳۸۹,۶۰۰(+8.7%) | ۳۶,۴۳۸(−4.8%) |
| 2013 | ۴۱۸,۸۵۰(+7.5%) | ۳۱,۷۸۸(−12.8%) |
| 2014 | ۳۷۶,۷۹۰(−10.0%) | ۳۴,۹۱۴(+9.8%) |
| 2015 | ۳۲۳,۵۱۰(−14.1%) | ۳۳,۹۰۷(−2.9%) |
| 2016 | ۳۱۴,۶۵۹(−2.7%) | ۳۳,۸۴۶(−0.1%) |
|
|
| Rank | Airport | Total passengers | Carriers |
|---|---|---|---|
| 1 | کانکون، کینتانا رو | 5,948 | Aeroméxico, Frontier |
| 2 | پونتا کانا | 2,986 | Frontier |
| 3 | ال آی سی. گوستاو دیاز اورداز | 2,727 | Frontier |
|
|
Competition
Capital Region International Airport competes with nearby متروپولیتن شهرستان وین دیترویت (DTW), Grand Rapids جرالد فورد (GRR), and the recent growth of Flint بیشاپ (FNT). In addition, the Michigan Flyer provides motorcoach service roundtrip from nearby East Lansing to Detroit Metro Airport 12 times daily.[10] In 2006 the Capital Region Airport Authority estimated that the airport lost approximately 162,000 passengers that year to nearby competing airports. The airport lost about $53 million in annual revenue as a result of the passenger losses.[11] According to the Airport Authority, a January 2010 leakage study found that 550,000 of the 873,000 airline tickets sold from mid-Michigan in 2009 were to travelers using other Michigan airports: 45% of travelers flew (originated) from Detroit Metro Airport, 37% from Lansing, 8% from Grand Rapids, and 7.6% from Flint. This resulted in an economic loss of $108 million to the Mid-Michigan region. The lost revenue to Lansing's airport was approximately $17 million.[9][12]
In March 2009 the Lansing State Journal cited a 2008 دانشگاه ایالتی میشیگان study finding that passengers out of Capital Region International Airport feel the airport is convenient to use, but more than two-thirds of those surveyed also flew from other Michigan airports during the previous year. This is despite 84% of passengers being satisfied with the airline service offered at Lansing's airport, a drop from 93% passenger satisfaction in 2002. The 2008 study noted that 49% of travelers thought Lansing's airport was more expensive to fly out of than Detroit Metropolitan Airport; 13% of travelers thought Lansing was less expensive.[13] The same study in 2002 found that 41% of travelers thought that Lansing was more expensive to fly out of than Detroit, and 14% thought Lansing was less expensive.[14]
فوربز in February 2009 ranked Capital Region International Airport tied for the 18th most expensive airport to fly from in the United States, with an average fare of 35¢ per mile. The magazine ranked two other Michigan airports as more expensive. چری کپیتل (TVC) in تراوس سیتی، میشیگان was ranked second (41¢ per mile), and امبیاس (MBS) northwest of سگینو، میشیگان was tied for the 11th most expensive airport in the country (36¢ per mile).[15]
An April 2011 a نیویورک تایمز study determined that the average fare from Capital Region International Airport was overpriced by $117. The تحلیل رگرسیون, based on third quarter 2010 data from the وزارت ترابری ایالات متحده آمریکا Bureau of Transportation Statistics, considered factors such as market size and average distance to destination. Fares at other Michigan airports were overpriced to a lesser extent: MBS airport by $114, Detroit Metro by $25, and Grand Rapids by $9; Flint airport was underpriced by $42. Kalamazoo airport fares were overpriced by $187.[16]
| Year | Lansing (LAN) | Detroit (DTW) | Grand Rapids (GRR) | Flint (FNT) | Kalamazoo (AZO) | Saginaw (MBS) |
|---|---|---|---|---|---|---|
| 2006 | $370.61 | $322.83 | $413.74 | $298.89 | $472.93 | $441.26 |
| 2007 | $364.39 | $307.29 | $420.68 | $281.37 | $471.01 | $441.08 |
| 2008 | $397.75 | $334.18 | $463.96 | $314.89 | $517.32 | $481.39 |
| 2009 | $434.59 | $313.67 | $409.85 | $275.23 | $500.55 | $434.69 |
| 2010 | $482.76 | $353.75 | $377.29 | $298.40 | $563.92 | $470.47 |
| 2011 | $433.59 | $378.55 | $400.11 | $334.90 | $579.23 | $474.77 |
| 2012 | $417.92 | $404.96 | $445.80 | $372.96 | $599.39 | $465.86 |
| 2013 | $391.67 | $422.25 | $442.34 | $367.80 | $575.49 | $546.03 |
| 2014 | $427.38 | $429.93 | $439.54 | $376.15 | $570.32 | $537.51 |
| 2015 | $473.93 | $416.23 | $421.46 | $387.89 | $576.16 | $550.78 |
Airports included are within ۱۰۰ مایل (۱۶۰ کیلومتر) or a 100-minute drive of LAN. Source: Airline Origin & Destination Survey, Office of the Assistant Secretary for Research and Technology، Bureau of Transportation Statistics، وزارت ترابری ایالات متحده آمریکا
جستارهای وابسته
منابع
- "Flight schedules and notifications". Retrieved 7 January 2017.
- "FLIGHT SCHEDULES". Retrieved 7 January 2017.
- "Timetable". Retrieved 7 January 2017.
- Air Traffic Activity System (ATADS), اداره هوانوردی فدرال. ATADS : Airport Operations : Standard Report, FAA.gov, Retrieved ۲۴ ژانویه ۲۰۱۷
- Research and Innovative Technology Administration (۲۴ ژانویه ۲۰۱۷). Lansing, MI: Capital Region International (LAN) Scheduled Services except Freight/Mail (Report). Bureau of Transportation Statistics، وزارت ترابری ایالات متحده آمریکا. Archived from the original on ۷ مارس ۲۰۱۶. https://web.archive.org/web/20160307034112/http://www.transtats.bts.gov/airports.asp?pn=1&Airport=LAN&Airport_Name=Lansing,_MI:_Capital_City&carrier=FACTS. Retrieved ۲۴ ژانویه ۲۰۱۷.
- Office of Aviation Analysis. U.S. International Air Passenger and Freight Statistics Report (Report). وزارت ترابری ایالات متحده آمریکا. http://www.dot.gov/policy/aviation-policy/us-international-air-passenger-and-freight-statistics-report. Retrieved ۲۲ ژوئیه ۲۰۱۵.
- Anders, Melissa (15 November 2013). "Michigan Flyer now has increased bus service between East Lansing, Ann Arbor and Detroit airport". MLive. Retrieved 19 November 2013.
- Capital Region Airport Authority Regional Market Development بایگانیشده در ۳ اکتبر ۲۰۱۱ توسط Wayback Machine, Capital Region Airport Authority, ctlr.msu.edu, 2007
- Selig, Robert F. Attend to Air Service Needs, Lansing State Journal, lsj.com, ۱۸ فوریه ۲۰۱۰, Retrieved ۱۹ فوریه ۲۰۱۲
- Steele, Jeremy W. Lansing Airport Seen As Nice, But Costly, Lansing State Journal, WZZM13.com, ۴ مارس ۲۰۰۹, Retrieved ۱۶ سپتامبر ۲۰۱۰
- Press Release. Lansing Air Passengers Rate Capital City Airport High in Satisfaction, Security, Convenience, ۷ ژانویه ۲۰۰۳, web.archive.org capitalcityairport.com archived on ۱۷ فوریه ۲۰۰۳, Retrieved ۱۴ ژوئیه ۲۰۱۰
- Bruner, Jon; Zack O'Malley Greenburg. America's Rip-Off Airports, Forbes Magazine, Forbes.com, ۱۶ فوریه ۲۰۰۹, Retrieved ۴ سپتامبر ۲۰۰۹
- Silver, Nate. Which Airports Have the Most Unfair Fares?, نیویورک تایمز, NYTimes.com, ۶ آوریل ۲۰۱۱, Retrieved ۲۵ اوت ۲۰۱۱
- Research and Innovative Technology Administration (2015). Average Domestic Airline Itinerary Fares By Origin City for 2015, Airline Origin and Destination Survey (Report). Bureau of Transportation Statistics، وزارت ترابری ایالات متحده آمریکا. http://www.transtats.bts.gov/AverageFare/. Retrieved ۲۷ آوریل ۲۰۱۶.
- «اطلاعات جهانی هوانوردی». worldaerodata.com. بایگانیشده از اصلی در ۱۱ ژوئیه ۲۰۱۲. دریافتشده در ۱۹ مارس ۲۰۱۲.
- «اطلاعات فرودگاهها و حملونقل هوایی». Airport-Data.com. دریافتشده در ۲۱ ژوئن ۲۰۱۲.